Ideal customer profile template: score your ICP with data, not personas
A free ICP template that scores companies on traits you can check, how to fill it from your own customers, and a worked example on 410 real businesses.
By Shehriar22 min read
Most ideal customer profile templates ask you to describe your customer: industry, size, goals, pain points.
You fill it in from memory, and you get something like "B2B companies, 50 to 500 people, in growth mode".
That matches every lead in your CRM. So it can't tell you who to call first, which is the one job an ICP has.
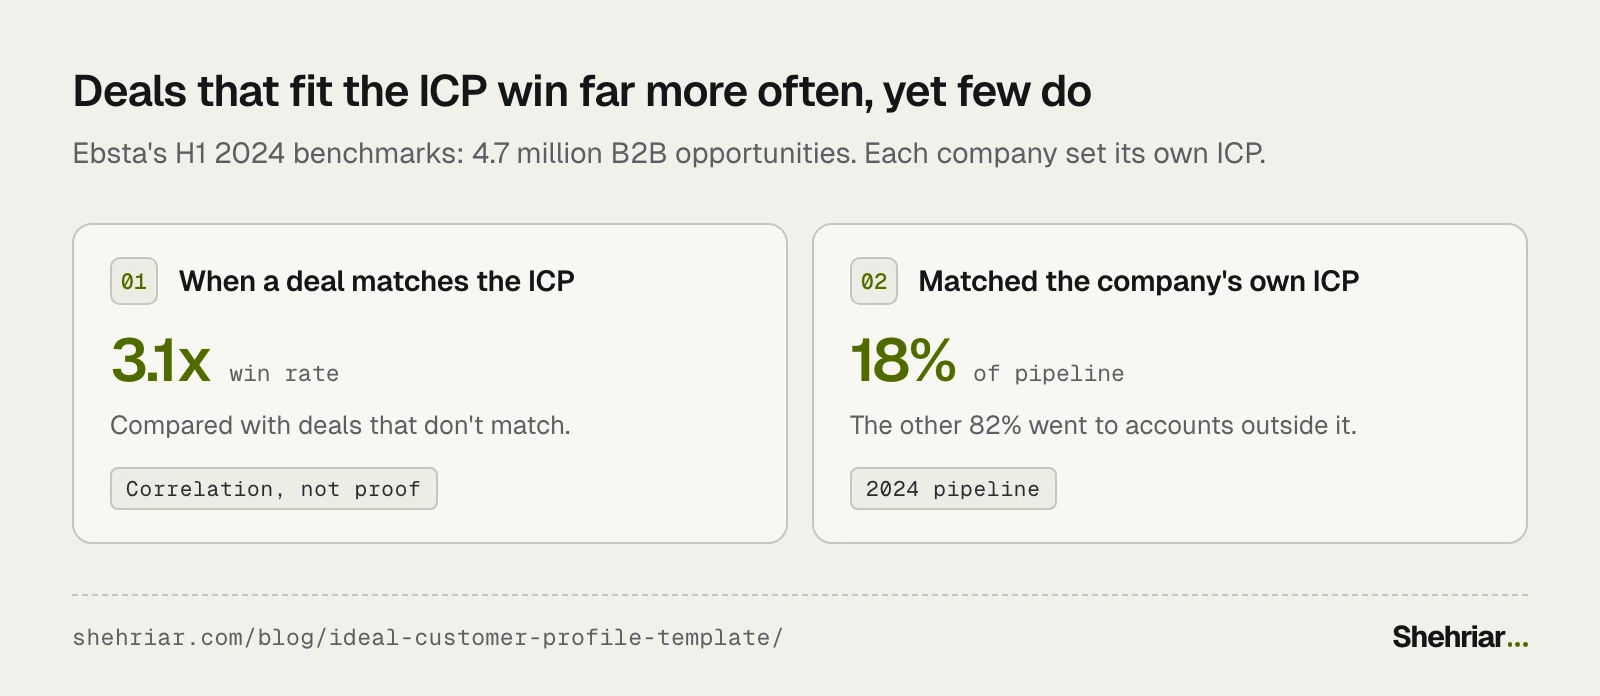
And the job matters. In Ebsta's data on 4.7 million B2B deals, deals that matched the company's ICP won 3.1x as often.
Yet only 18% of the pipeline matched.
The template below fixes that by scoring. Every company gets a number from traits you can check.
Then you can sort a list of 400 and start at the top.
What goes in an ideal customer profile template?#
5 parts: criteria you can check, a weight for each, an anti-ICP, tiers, and a job for each tier.
Here's the criteria part. Each row is a trait, and each score is a value you could look up, not an opinion.
| Criterion | 0 means | 1 means | 2 means | 3 means | Where to find it |
|---|---|---|---|---|---|
| Business type | A type you don't serve | A close neighbor | A type you've sold to | Your best customers' type | CRM, website, LinkedIn |
| Size | Far outside your range | Just outside it | At the edge of your range | Inside your best range | Employees, locations, revenue |
| The problem you solve | No sign of it | Could have it | One clear sign | Several clear signs | Their website, job posts, reviews |
| Tools they pay for | Nothing related | A free tool | A competitor's tool | A tool yours plugs into | Job posts, website source, calls |
| Trigger: why now | Nothing recent | Over a year ago | In the last year | In the last 90 days | Hiring, funding, new location, news |
| Reachable | No route in | A general inbox | A phone or contact form | A named role you can contact | Website, LinkedIn, CRM |
Swap any row for a trait that matters in your market. Keep 5 to 8 rows: with more, each weight means less.
The last 2 rows say when and how to reach a company, not whether it fits.
On a big list, leave them out of the score. Use them to order the accounts inside each tier.
The 3 other parts sit under the table:
- Weights: 1 to 3. The traits that best separate good customers from bad ones get a 3.
- Anti-ICP: traits that rule a company out, however well it scores. "Wants it done for free" is one.
- Tiers: add up score × weight and divide by the maximum. The percentage sets the tier.
| Tier | Who | What they get |
|---|---|---|
| A | The top of the list, as many as your team can work properly in a quarter | Outbound, fast follow-up, your best people |
| B | Worth a look | Nurture, content, ads |
| C | Everyone else | A lighter offer, or no effort at all |
| Out | Anyone on the anti-ICP | A polite no, or a referral |
Get the free ICP scoring sheet. It has this template with the math built in, plus a tab to test it.
The worked example below is in it too. No email needed.
Isn't an ICP just a buyer persona?#
No. They answer different questions, and mixing them up is how templates end up describing everyone.
| Term | Answers | Built from |
|---|---|---|
| Ideal customer profile (ICP) | Which companies should we go after? | Company traits you can check |
| Buyer persona | Who inside them buys, and what do they care about? | Interviews, roles, goals, objections |
| Anti-ICP | Which companies should we never chase? | Your lost deals and churned customers |
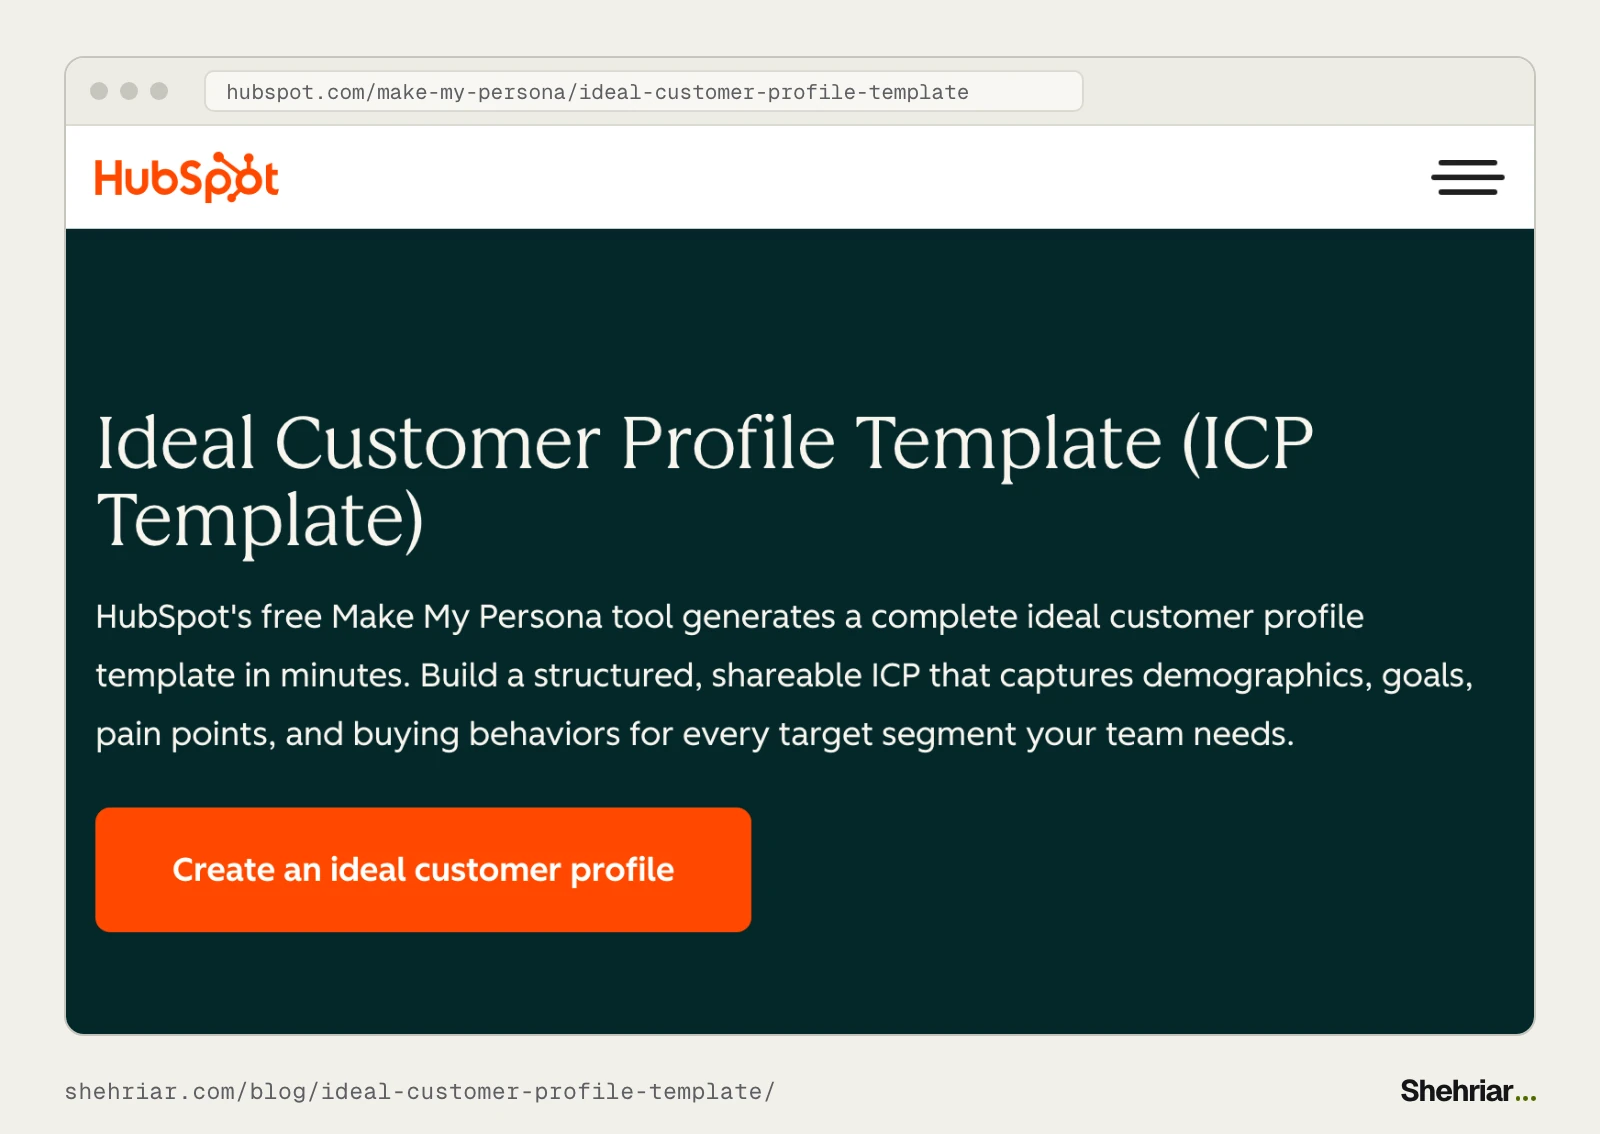
Even HubSpot's ideal customer profile template is built in its persona maker. It asks for job title, age, education and social networks.
Build the ICP first. It decides which companies get your time. Personas then shape what you say to the people inside them.
How do you fill in the template from your own customers?#
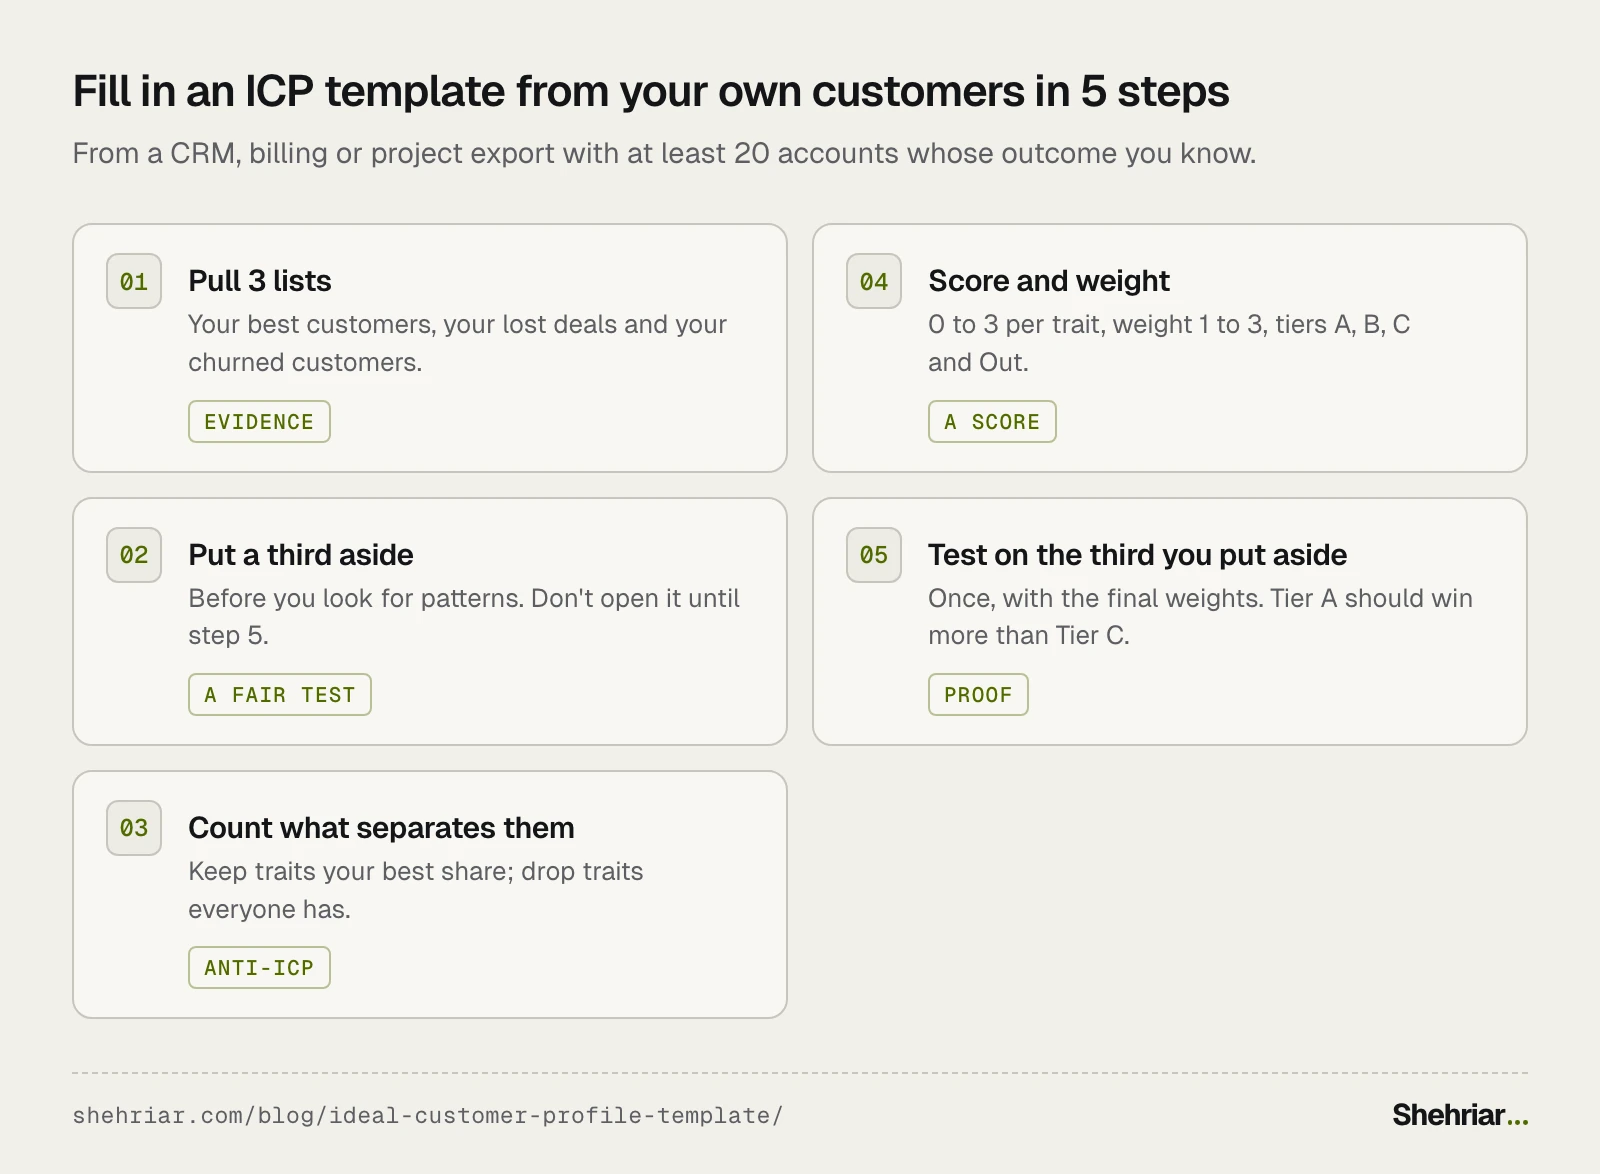
In 5 steps. You need a CRM, billing or project export with at least 20 customers, plus the deals you lost.
Fewer than that? Skip to the next section.
Step 1: Pull your best, lost and churned customers#
Export 3 lists, one row per company:
- Best customers: the ones you'd clone. Judge them on how long they stay and what they cost to serve, not deal size alone.
- Lost: they saw a proposal or a trial, then didn't buy.
- Churned: they bought, then left. For an agency, that's a retainer that ended.
Give each row the traits you could see before the deal: industry, size, location, tools they use and lead source.
Deal size, days to close and loss reasons help you judge "best" and read your losses.
Don't score them, though. You only learn them after the deal.
If one company sits in your CRM as several contacts or locations, merge them into 1 row. You're scoring companies, not people.
Step 2: Put a third of them aside before you look#
This is the step most ICP work skips, and it decides whether you can trust the result.
You'll pick traits by looking at your accounts. Test the finished score on those same accounts, and it will look better than it is.
It's marking its own homework.
So before you study anything, pick a random third of the accounts and move them to another tab. Don't open it until Step 5.
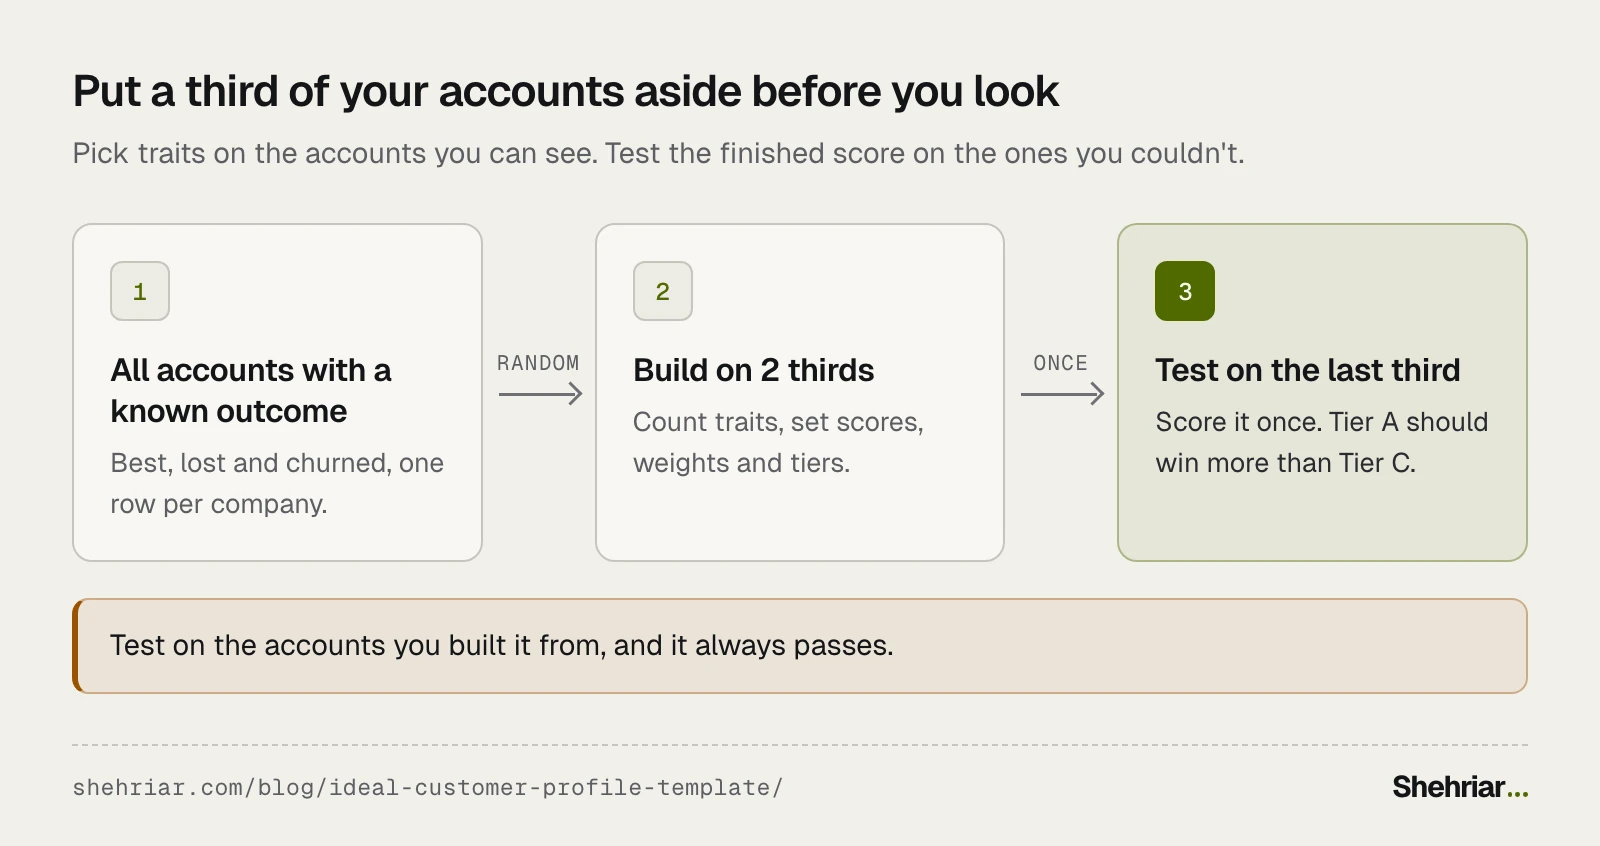
Too few accounts to spare a third? Split by time instead. Build on everything before a date, then test on the accounts that came after.
Step 3: Count which traits separate the lists#
For each trait, work out what share of each list has it. Here's how to read the counts, with invented numbers:
| Trait (invented example) | Best | Lost | Churned | Verdict |
|---|---|---|---|---|
| Uses a competitor's tool | 60% | 20% | 25% | Keep: nearly 3x as common among your best |
| 50 to 200 employees | 55% | 35% | 30% | Keep, with a lower weight |
| Has a website | 98% | 97% | 99% | Drop: everyone has it |
| Fewer than 10 employees | 5% | 30% | 45% | Anti-ICP |
Keep a trait when it's far more common among your best customers. Drop it when every list has it equally: it adds points, not information.
Under about 30 accounts per list, treat every pattern as a hint.
Most small companies are there, and that's fine. Step 5 tells you which hints hold.
Traits that cluster in your lost and churned lists become the anti-ICP.
Read the reasons first, though. A deal lost on timing says nothing about fit.
One lost on price only does if they could never afford you.
Look for 4 kinds of trait: firmographic (industry, size, location) and technographic (tools they pay for).
Then the problem you solve, and a trigger that makes them need you now.
Step 4: Turn the traits into scores and weights#
For each trait you kept, write what 0, 1, 2 and 3 mean, using a real value.
"Reviews: 300+ is 3, 100 to 299 is 2" works. "Innovative culture" doesn't.
Then weight it, using the gap from Step 3 as a starting point:
- Weight 3: at least twice as common among your best as among lost and churned.
- Weight 2: about 1.5 times as common.
- Weight 1: a smaller gap that's still real.
Only trust a gap that covers at least 10 accounts. 2 accounts against 1 is a coincidence, not a 2x gap.
Set the Tier A cutoff by what your team can work properly in a quarter.
If 2 people can each give 50 accounts real attention, Tier A is about 100 accounts.
Can't see a trait for an account? Leave it blank instead of scoring 0. The sheet scores it on the traits it can see.
If more than half the weight is blank, the sheet marks the account "Check". Research it before it goes in any tier.
Step 5: Test the score on the third you put aside#
Now open the tab from Step 2. Score those accounts once, with your final weights, and change nothing afterwards.
Then compare the tiers. Did Tier A win more often than Tier C? The sheet's Back-test tab counts it for you.
If it did, your ICP predicts something. If it didn't, it only describes the accounts you built it on.
Then go back to Step 3, and test again on the next batch of deals.
I saw why the test has to use later data on keklik.io, my ready-made scrapers on Apify.
In October, its biggest use was one-off city lead lists. In November, review monitoring and job-post feeds took over.
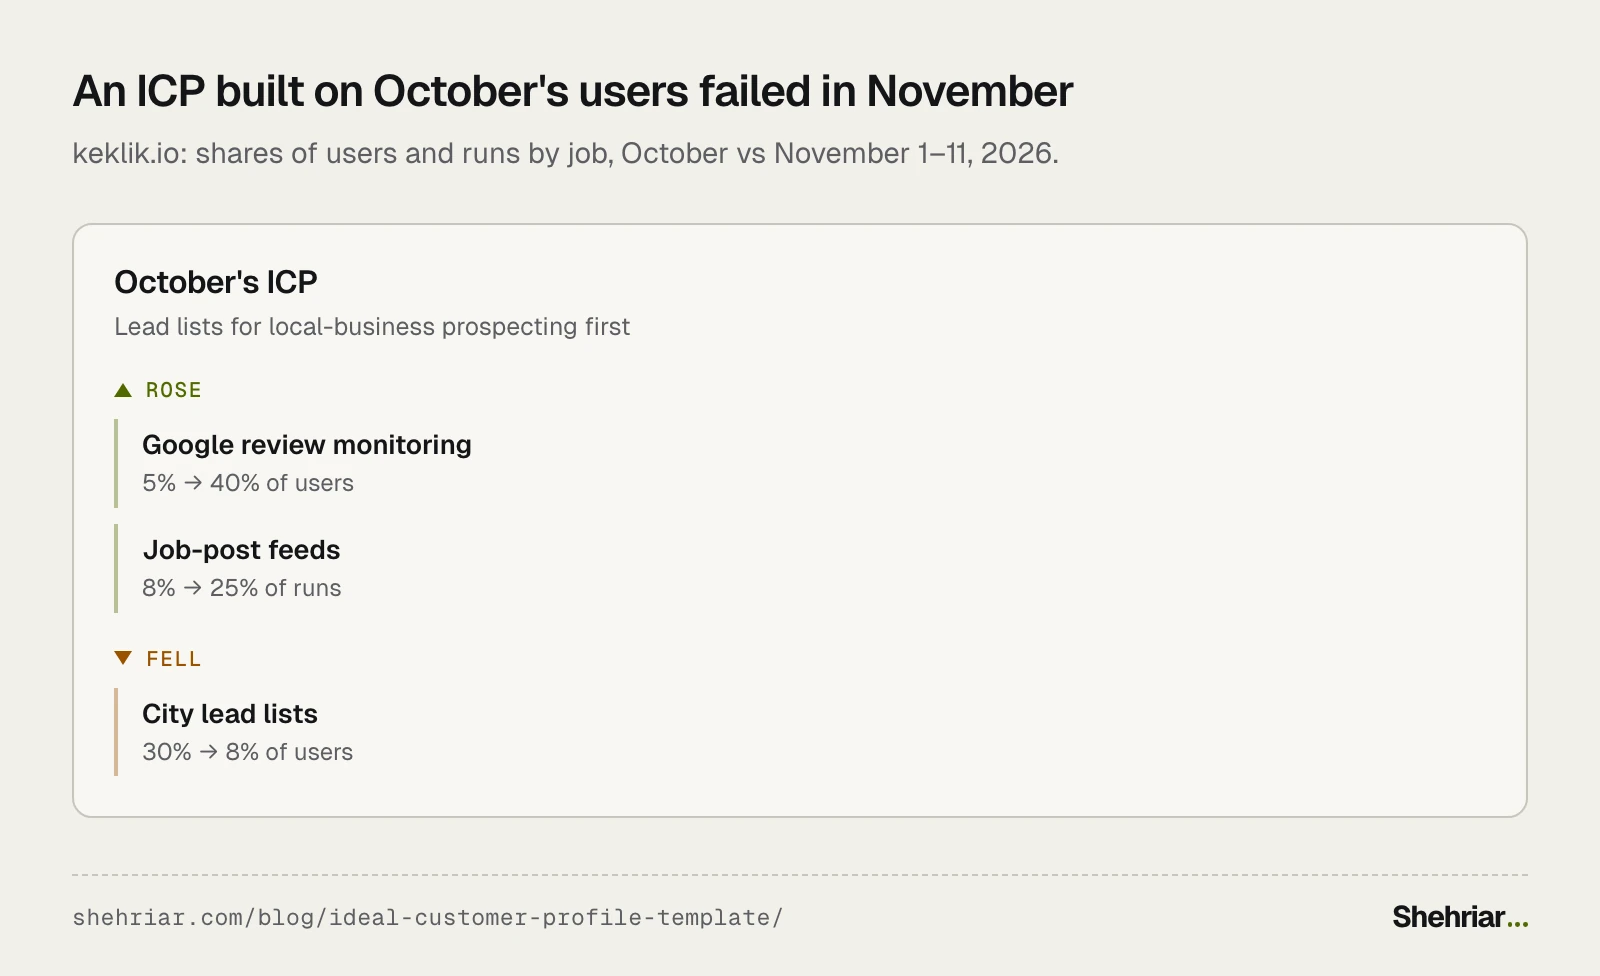
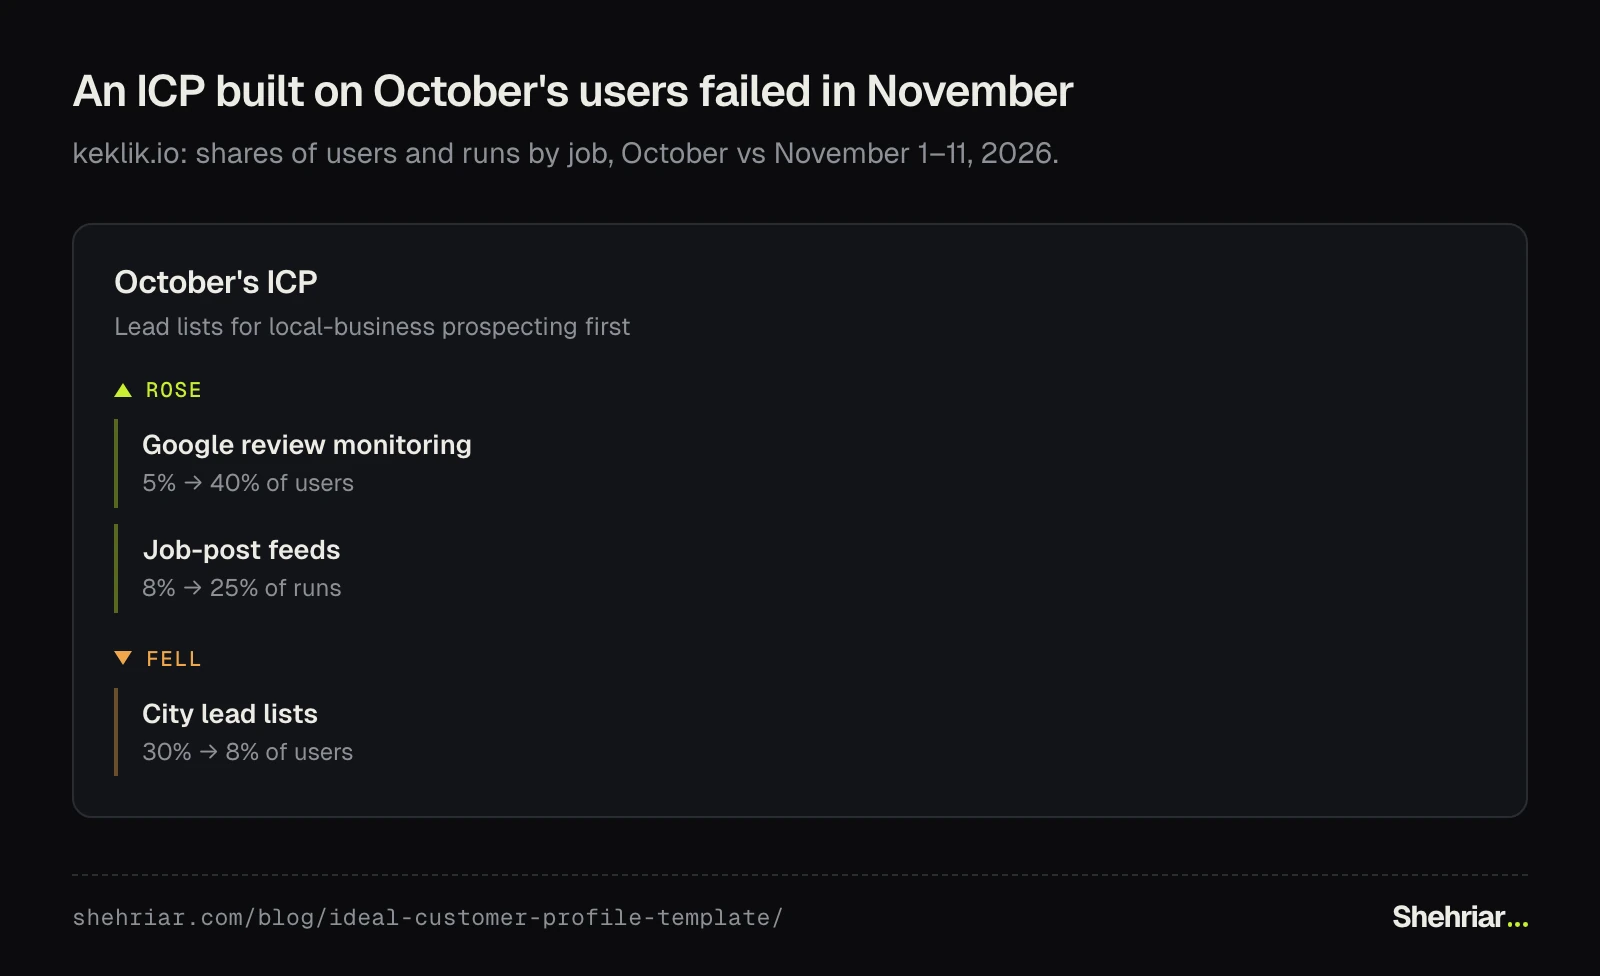
That wasn't a scored test, but the lesson is the same.
A profile built on October alone would have aimed at a use that was fading a month later.
Once it passes, re-score every quarter. Check triggers every month, since they go stale fastest.
Rebuild after a pricing change, a new product or a new market.
What if you have fewer than 20 customers?#
Then you can't count patterns yet, and most small companies are here.
Write the ICP as a guess, and design the test before you trust it.
- List what was true before each customer bought. The trigger, how fast they decided, and how easy they are to serve.
- Mark each criterion "seen" or "guess". Seen means a customer did it. Guess means you believe it.
- Keep only traits you can check from outside. Websites, Google Maps, LinkedIn, job posts, or one question on a call.
- Score 30 to 50 real prospects. Contact Tier A and Tier C the same way. If Tier C replies as often, a guess is wrong.
My SEO tool, Serpint, went through this. Its first ICP assumed teams would cancel Ahrefs or Semrush for it. I dropped that within 3 weeks.
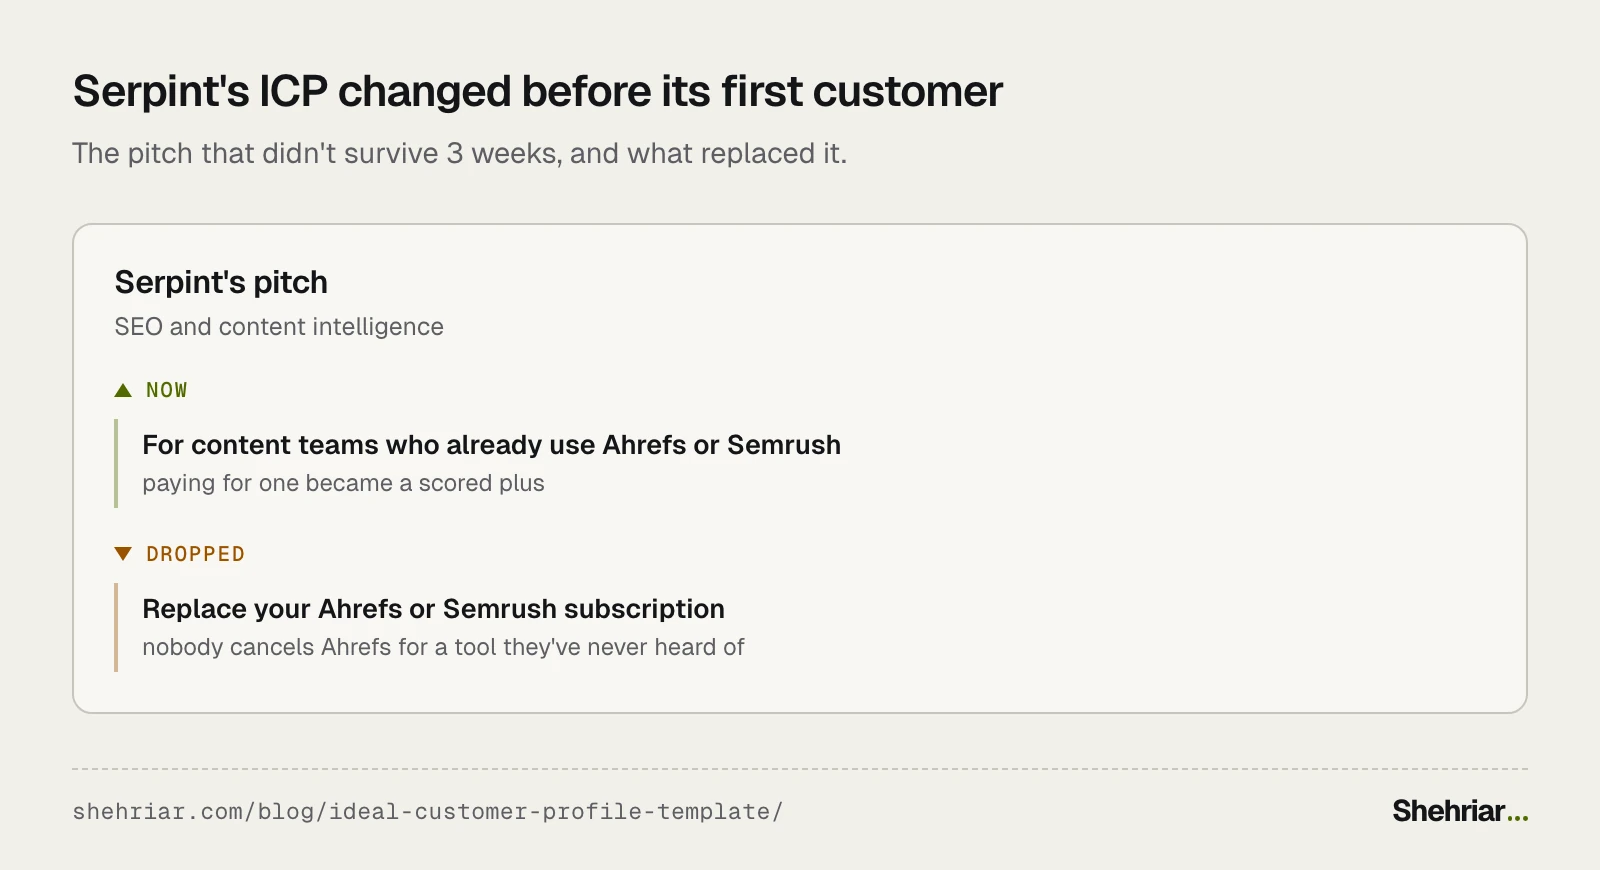
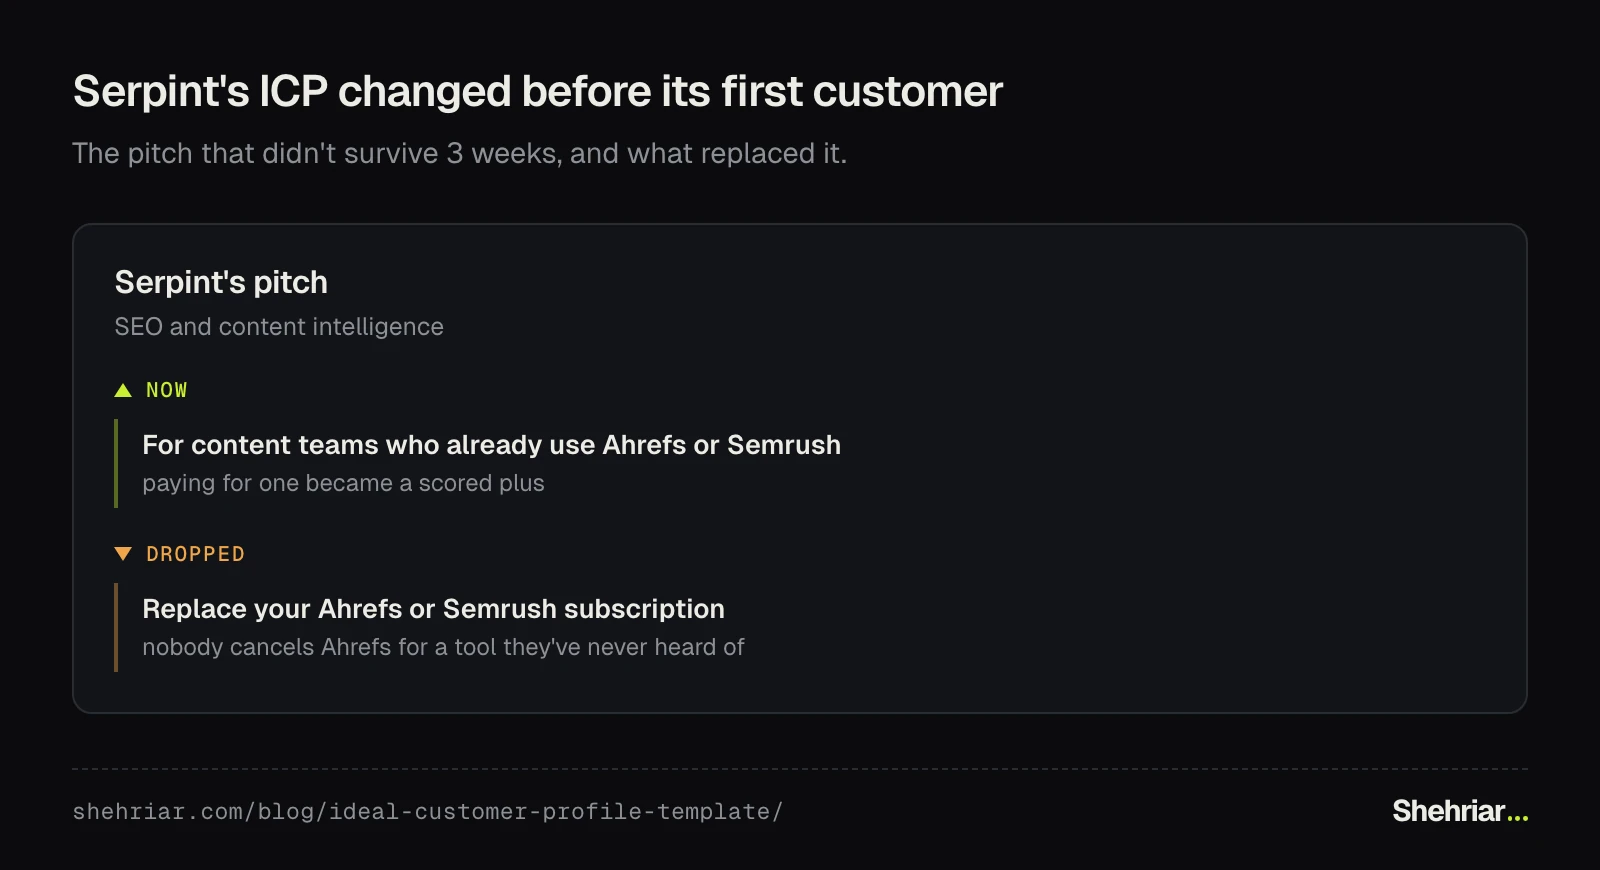
A team won't cancel a tool it trusts for one it's never heard of.
So "already pays for Ahrefs or Semrush" became a plus in the score.
Prompt 4 below turns your notes into a guess-version ICP with a 30-day test plan.
What does a filled-in ICP look like?#
Here's the template filled in on real data: a whole market, scored from the outside, before a single sales call.
Say Keklik Technologies, my studio, offered dental practices online booking with reminders. Which Austin practices should it call first?
It has no dental customers, so there are no wins to count yet.
That makes this the guess version: score the market, then let the first calls test it.
Pull the market#
I pulled every Google Maps listing for "dentist" in Austin, TX, with keklik.io's Google Maps Leads Scraper.
Each row has the category, reviews, rating, website, booking link and any email on the practice's site.
The whole city cost about $2. Locations that share a website became 1 account, which left 410 practices.
The criteria#
| Criterion | 3 means | Weight | Where it comes from |
|---|---|---|---|
| Booking gap (the problem) | No booking link on Google | 3 | Booking link on the listing |
| Patient volume | 300+ reviews | 3 | Review count, all locations |
| Reachable | An email on their website | 2 | Emails from the practice's site |
| Business type | General dentist | 1 | Google category |
| Size | 2 to 5 locations | 1 | Listings sharing a website |
| Reputation | Rating 4.5+ | 1 | Google rating |
| Active listing | Claimed by the owner | 1 | Claimed flag |
The booking gap is the problem this offer solves. 185 practices show no booking link on Google, so they score 3.
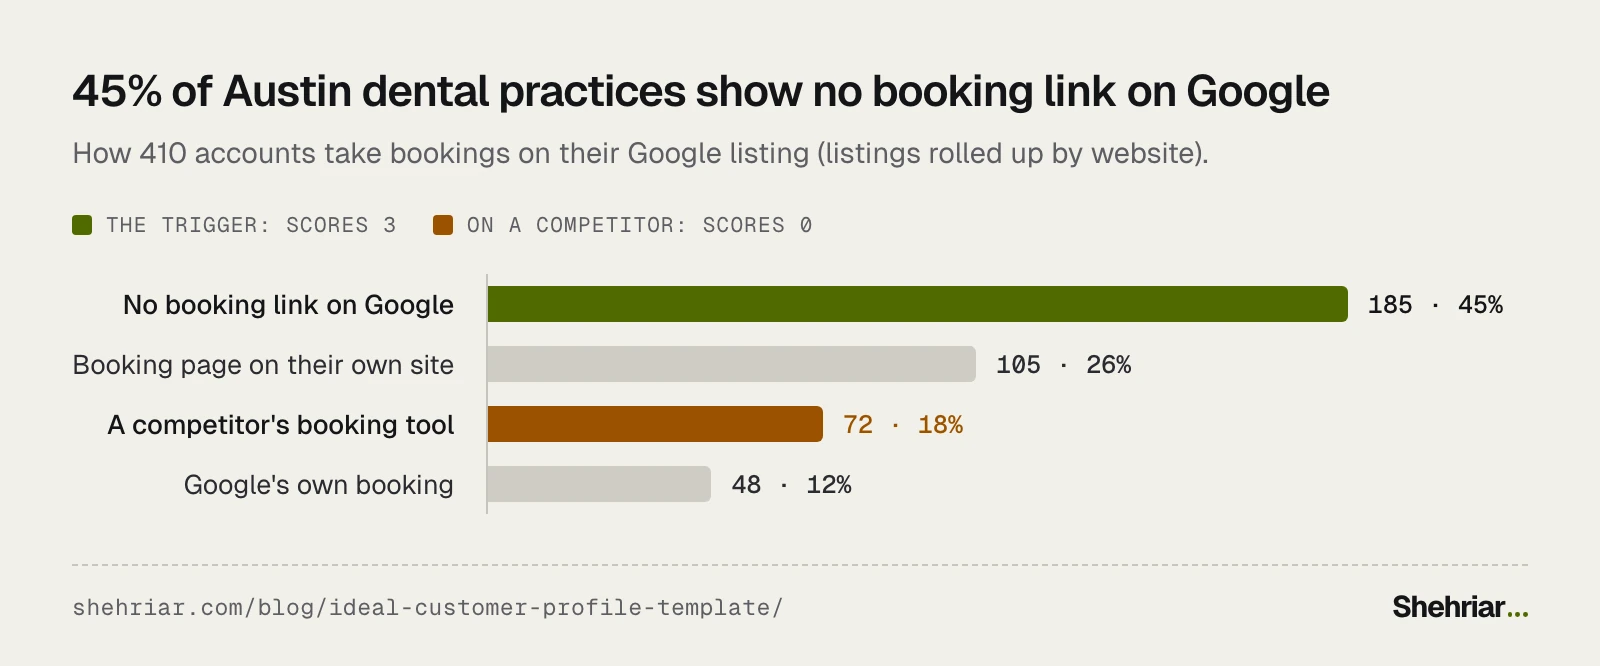
Some of those 185 may still take bookings on their own website. So a 3 here means "worth checking", not "proven need".
The 72 on a competitor's tool, most often Modento, NexHealth or Weave, score 0. Switching them is a harder sale.
For a switching campaign, flip it to 3.
Review count stands in for patient volume. It favors older practices, so treat it as a rough guide.
One practice, scored#
Take a practice with 2 locations, 242 reviews and a 4.7 rating. It has an email on its site, and no booking link on Google:
| Criterion | Score | × Weight | Points |
|---|---|---|---|
| Booking gap | 3 | 3 | 9 |
| Patient volume (242 reviews) | 2 | 3 | 6 |
| Reachable | 3 | 2 | 6 |
| Business type | 3 | 1 | 3 |
| Size (2 locations) | 3 | 1 | 3 |
| Reputation | 3 | 1 | 3 |
| Active listing | 3 | 1 | 3 |
| Total | 33 of 36 = 92%: Tier A |
Why did the first version put 285 practices in Tier A?#
My first version used weight 3 for Business type and cutoffs at 70% and 50%.
It put 285 of 410 practices in Tier A. That's most of the city, not a priority list.
The cause was 3 criteria that nearly every practice passes.
The search had already picked dentists, and most practices have good ratings and a claimed listing.
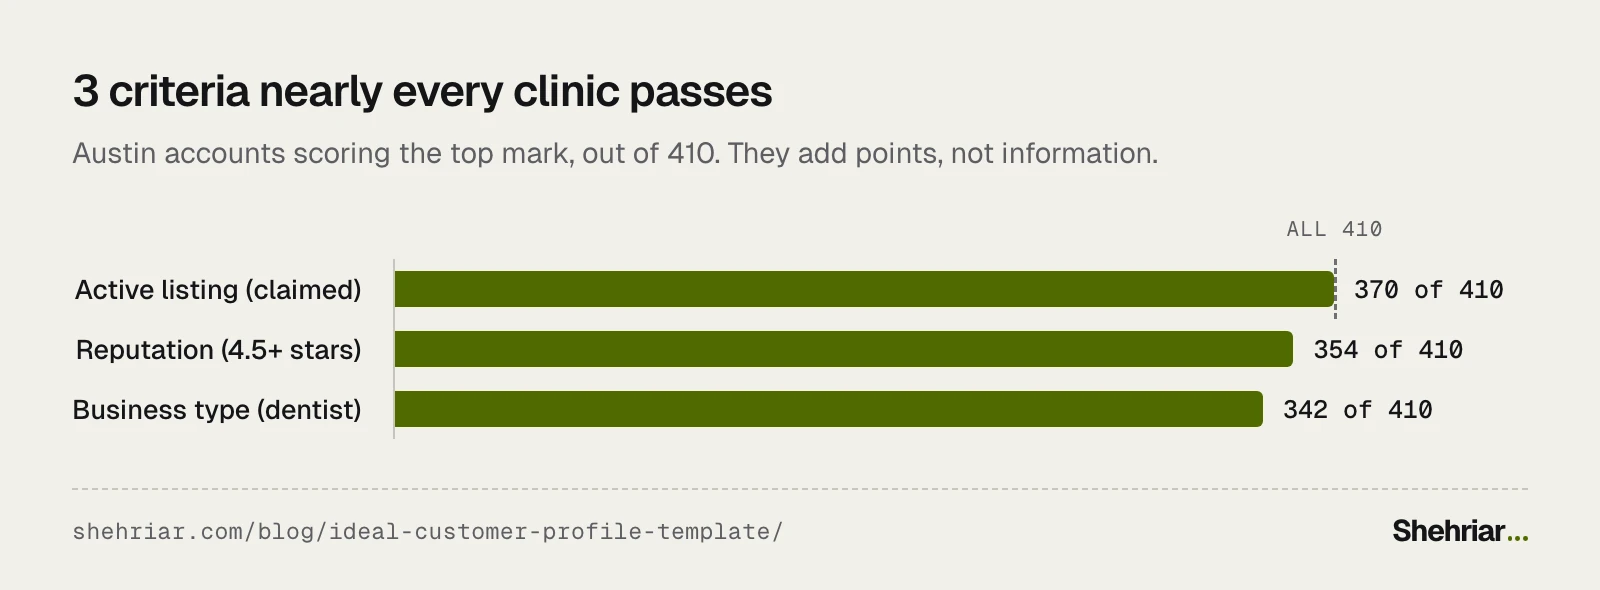
I cut Business type to weight 1, like the other two, and raised the cutoffs to 82% and 67%.
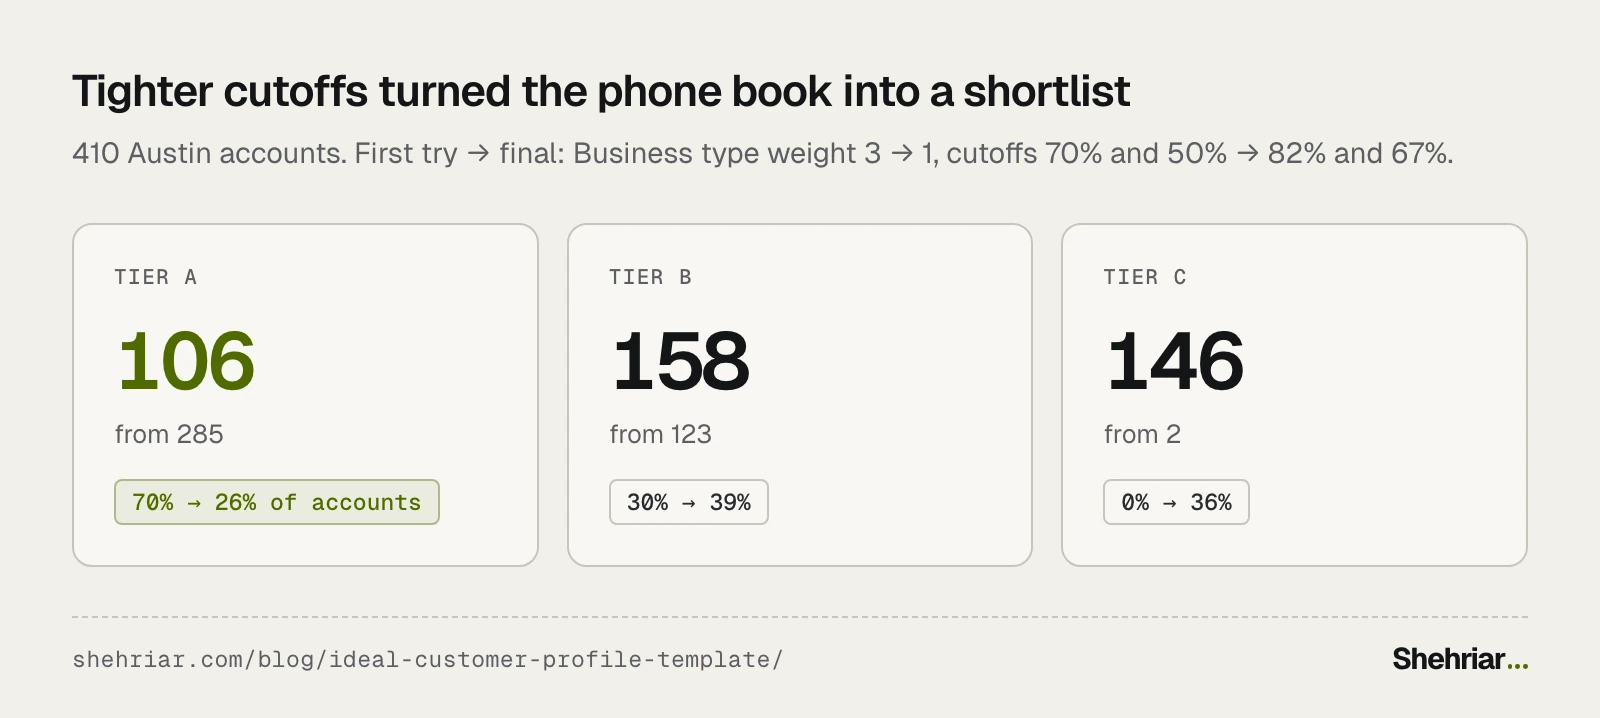
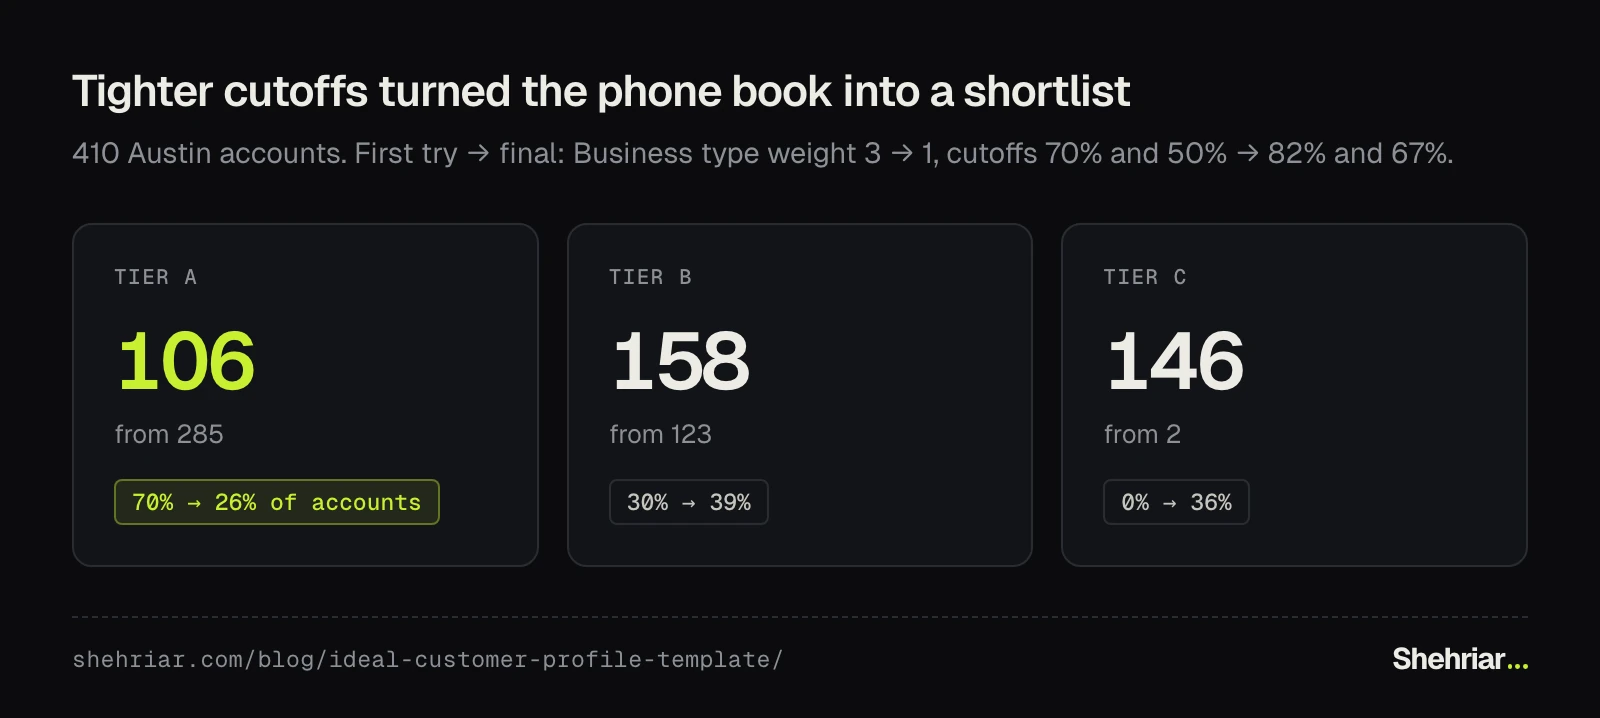
Now Tier A holds 106 practices, a list 2 people can work in a quarter.
That's a workable list, not yet proof those 106 buy more.
The first test is outreach. Work Tier A and a sample of Tier C the same way.
Log every reply and every win on the Back-test tab.
30 calls can show a big gap, not a small one. The real verdict is the deals that close over the next quarter.
What can't public data tell you?#
Which practice software a clinic runs, its budget, who signs and its no-show rate.
If you have customers already, match them to these rows by website or phone, then re-weight.
Score businesses, not people. I left out owner and reviewer names, and the sheet hides practice names.
Google's terms restrict scraping, and a sole trader's email can be personal data under GDPR. Check both before outreach.
Does the template change for agencies and service businesses?#
The steps stay the same. 3 definitions change:
- Lost: a proposal they declined.
- Churned: a retainer that ended, or a client who never came back.
- Best: profit per hour and repeat work, not the size of the first invoice.
If you sell to local businesses, some scores flip. A weak Google listing is a sign of need.
For a local SEO agency, a roofer with 12 reviews beats one with 900.
Can ChatGPT or Claude build your ICP?#
Yes, with your data and firm rules.
Ask it for "an ideal customer profile for my business" with no data, and you get an untested persona.
The 4 prompts below make it work from your file, show its counts and test its own answer.
I tested Prompt 1 in a fresh ChatGPT account. The test file had 60 accounts with a pattern hidden in it.
It set 20 aside before looking and found the planted pattern. It also warned that every group was too small to trust.
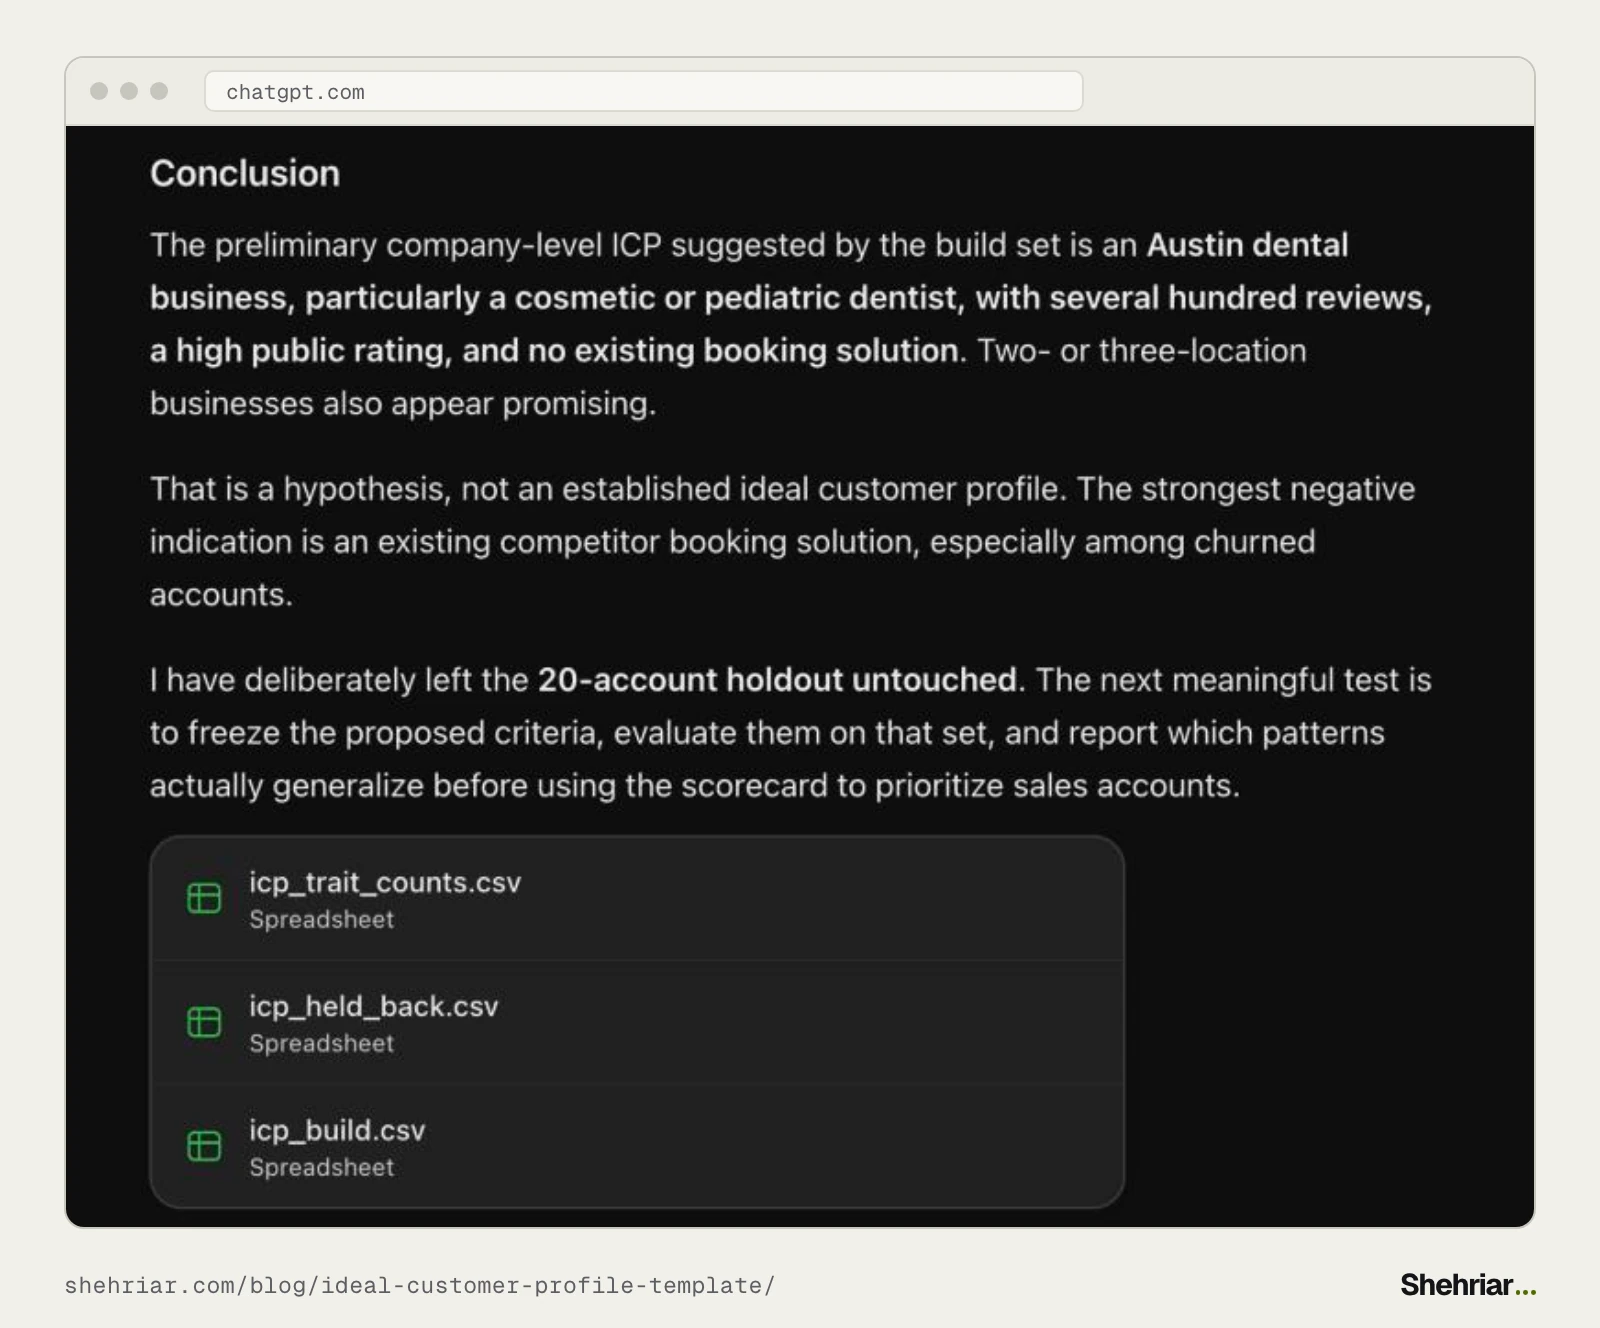
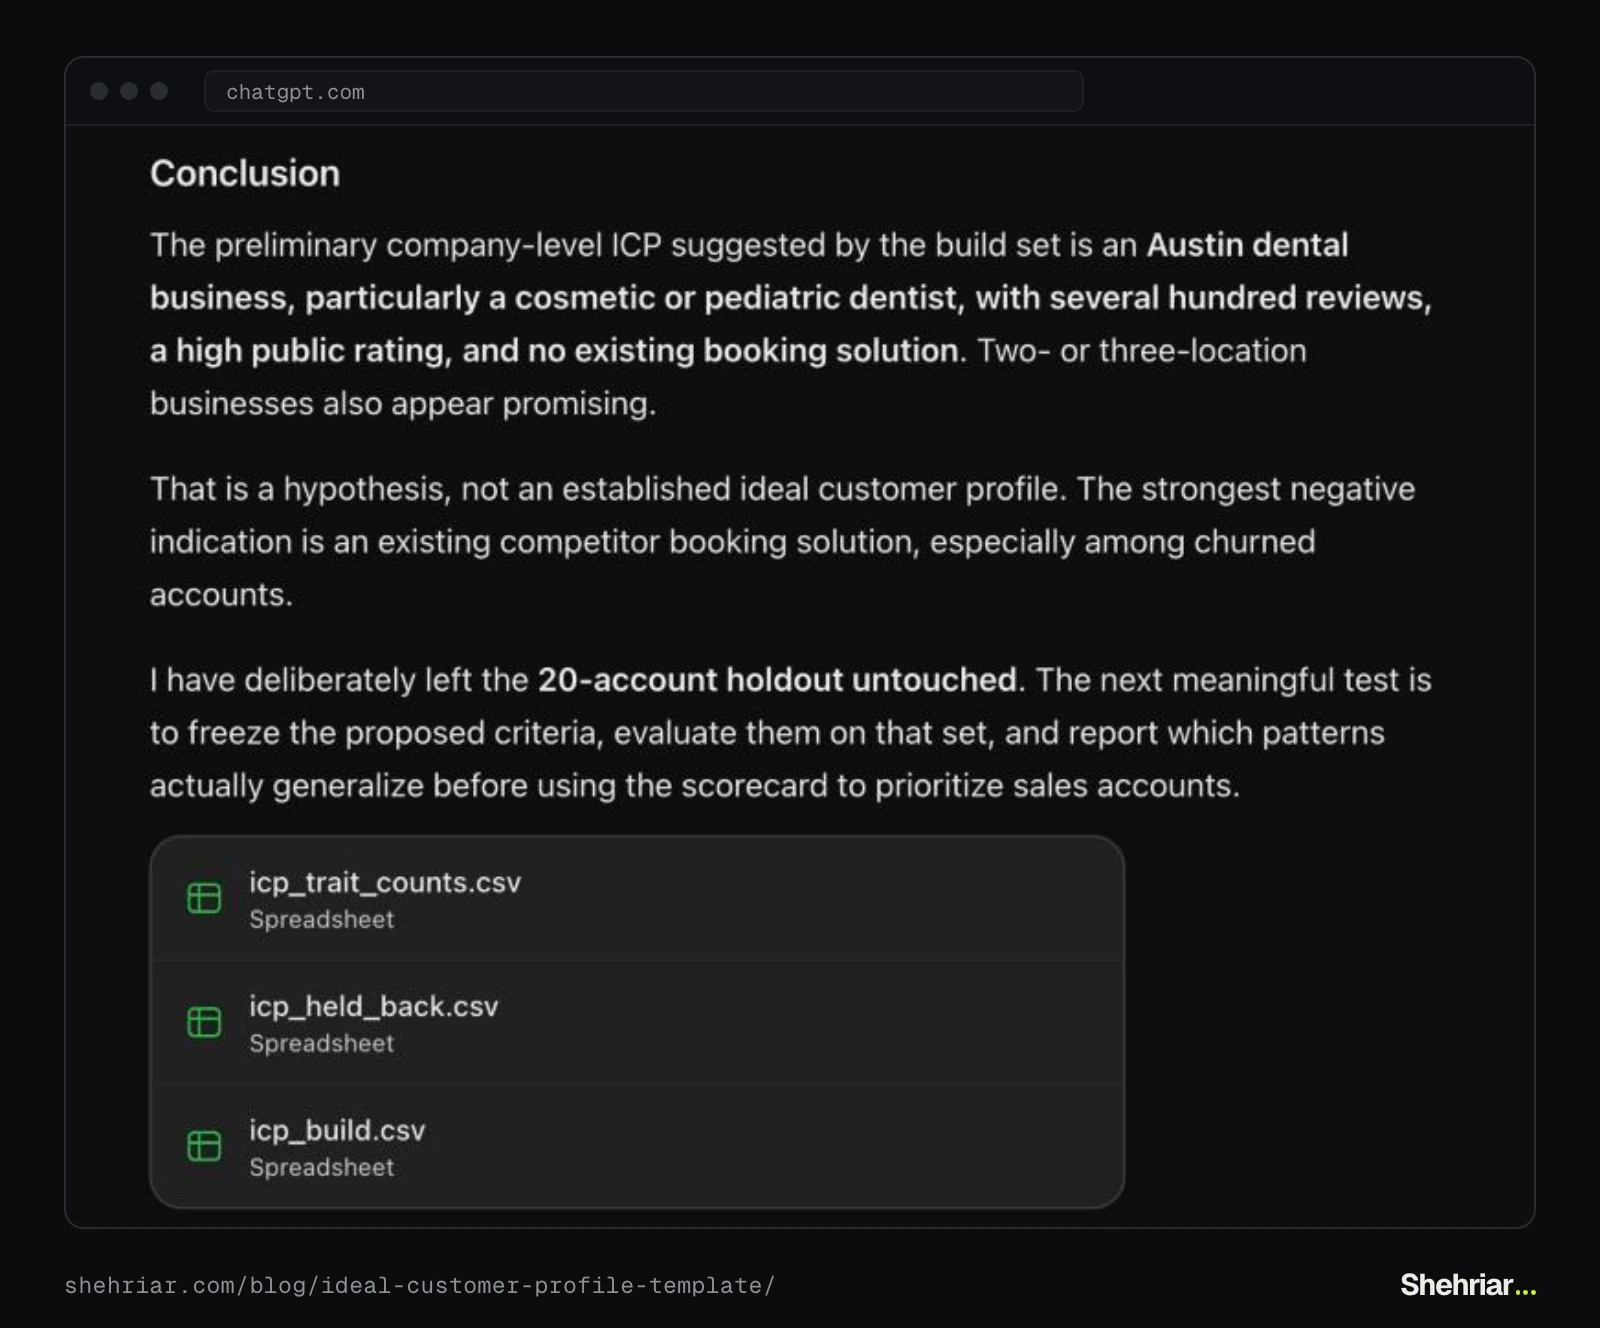
It also picked a trait I hadn't planted: cosmetic and pediatric dentists, from 5 wins. That's what the held-back 20 are for.
Prompt 1: Find my ICP in my customer data#
Attach a CSV with 1 row per company and an outcome column: won, churned or lost.
You are helping me build an ideal customer profile (ICP) from evidence. An ICP describes which COMPANIES are worth winning, not the people inside them (that's a buyer persona, and I don't want one here).

The attached file has one row per account and an "outcome" column: won, churned or lost.

1. Before anything else, split the accounts at random: two thirds to build on, one third held back. Use code with a fixed seed if you can, and give me the held-back third as a file. From here on, use only the build set. Don't look at the held-back third.
2. Tell me how many build accounts are in each outcome. If any group has fewer than 30, warn me that its patterns are hints, not findings.
3. For every column that could describe a company before the deal, compare how often each value appears among won, churned and lost accounts. Leave out anything known only afterwards (deal size, days to close, loss or churn reasons) as a trait. Show the counts in a table (trait | won | churned | lost). Group number columns into 4 or 5 bands, and merge any band with fewer than 10 accounts into its neighbor.
4. List the 5 to 8 traits that best separate won from churned and lost accounts. Drop any trait that nearly every account shares: it adds no information.
5. List the anti-ICP: traits that show up mostly in churned or lost accounts. If the file has loss or churn reasons, leave out losses due to price, timing or process: those aren't about fit.
6. Turn the traits into criteria scored 0 to 3. For each, say what 0, 1, 2 and 3 mean as a real column value. Give a weight of 3 if the trait is at least twice as common among won accounts as among churned and lost ones, 2 if about 1.5 times, and 1 if less. Keep each scale in a sensible order (more of a good thing scores higher) unless at least 10 accounts per group clearly show otherwise.

Rules: don't invent anything that isn't in the file. Where the data can't answer something, write "unknown" and say what data would. No persona fields (age, goals, personality). Show your counts so I can check them.

Output the criteria as a table with these columns: Criterion | Why it predicts a good customer | Where the data comes from | 0 means | 1 means | 2 means | 3 means | Weight
Prompt 2: Test it on the accounts you held back#
Run it in the same chat, straight after Prompt 1.
Now test the criteria: first on the build set, then once on the held-back third.

1. Score every build account 0 to 3 on each criterion, multiply by the weights and add up. Divide by the maximum possible score to get a percentage. If a cell is empty, leave that criterion out of both the score and the maximum.
2. Set the Tier A cutoff so about the top quarter of accounts are Tier A, and the Tier B cutoff so about the next third are Tier B. Anti-ICP accounts are "Out" whatever their score.
3. For each tier, show: accounts, won, churned, lost, win rate ((won + churned) / accounts) and kept rate (won / (won + churned)).
4. If Tier A doesn't have a clearly higher win rate than Tier C, change the weights, explain each change, and show the new table.
5. Then score the held-back third once, with the final weights and cutoffs, and show the same table. Change nothing after this step. Tell me plainly whether Tier A still beats Tier C. If it doesn't, the ICP only describes the accounts it was built on.

Use code to do the arithmetic if you can run code. Show the final weights and cutoffs.
Prompt 3: Score a new list of prospects#
Attach the list: a CRM export, a bought list or public data you collected.
Score the attached list of prospects against my ICP criteria below.

[paste the criteria table from Prompt 1, with weights and cutoffs]

1. First roll the rows up to one per company (the same website domain = the same company), and tell me how many rows became how many accounts.
2. Score each account on each criterion from the columns in the file. If a cell is empty, mark that criterion unknown and leave it out of both the score and the maximum. Tell me which criteria the file can't support at all.
3. Give each account its total, percentage and tier (A, B, C or Out). If over half the criteria weight is unknown for an account, mark it "Check" instead of giving it a tier.
4. Show the tier counts, the top 10 Tier A accounts with the 2 criteria that lifted each one most, and any criterion where almost every account gets the same score.
5. List what this data can't tell me about these accounts (budget, who signs, current contracts), so I check it before reaching out.

Use code for the scoring if you can, and give me the result as a CSV I can download.
Prompt 4: When you don't have enough customers yet#
I'm early and don't have enough customers to find my ICP in data. Help me build a guess-version ICP I can test, not a persona.

What I sell: [one line]
Who has bought or worked with me so far, and what happened: [a few lines per customer, no names needed]
Who I thought would buy, and why: [a few lines]

1. From what I gave you, separate what's evidence (something a customer did) from what's my assumption. Label each.
2. Propose 5 to 7 criteria scored 0 to 3 that are checkable from public data (websites, Google Maps, LinkedIn, job posts) or a short question on a call. Nothing that can only be guessed.
3. Name the anti-ICP: who would buy and then be unhappy, or cost more to serve than they pay.
4. Give me a 30-day test: how many prospects to score, how to contact Tier A and Tier C the same way, and what result would prove each criterion wrong.

Label the whole thing "guess" and keep it short.
What does the Claude skill add?#
If you use Claude, download the ICP scoring skill and add it under Settings, then Skills.
Then ask Claude to "build my ICP from this export".
It runs the 5 steps, holds back a third first, and leaves the arithmetic to a small script.
It warns you when a criterion gives most accounts the same score. On the Austin data, it matches the sheet's tiers exactly.
Want a second opinion on your ICP?#
Your ICP decides where your team spends its week.
If you'd like me to score yours against your real wins and losses, book a GTM assessment.
I'll tell you which accounts deserve your best people, and which to stop chasing.
FAQ#
What is an example of an ideal customer profile?
"General dental practices with 2 to 5 locations, 300+ Google reviews and no online booking." Every part is a field you can check. This post scores 410 Austin practices against an ICP like it.
How many criteria should an ICP have?
Between 5 and 8. With more, each weight means less, and accounts collect points for traits that barely matter.
How do you build an ICP with no customers?
Write it as a guess, using only traits you can check. Score 30 to 50 real prospects, contact the top and bottom tiers the same way, and compare the replies.
How often should you update your ICP?
Re-score your accounts every quarter, and check triggers every month. Rebuild the ICP after a pricing change, a new product or a new market.
Does an ICP template work for e-commerce?
Only for stores that sell to businesses. A store that sells to consumers groups customers by what they buy instead, usually with RFM (how recently, how often, how much).
Can I build an ICP with ChatGPT?
Yes, with your customer data and firm rules. Without data, you get a persona. The prompts in this post make it show its counts and test its answer.